NL North
10 May 18
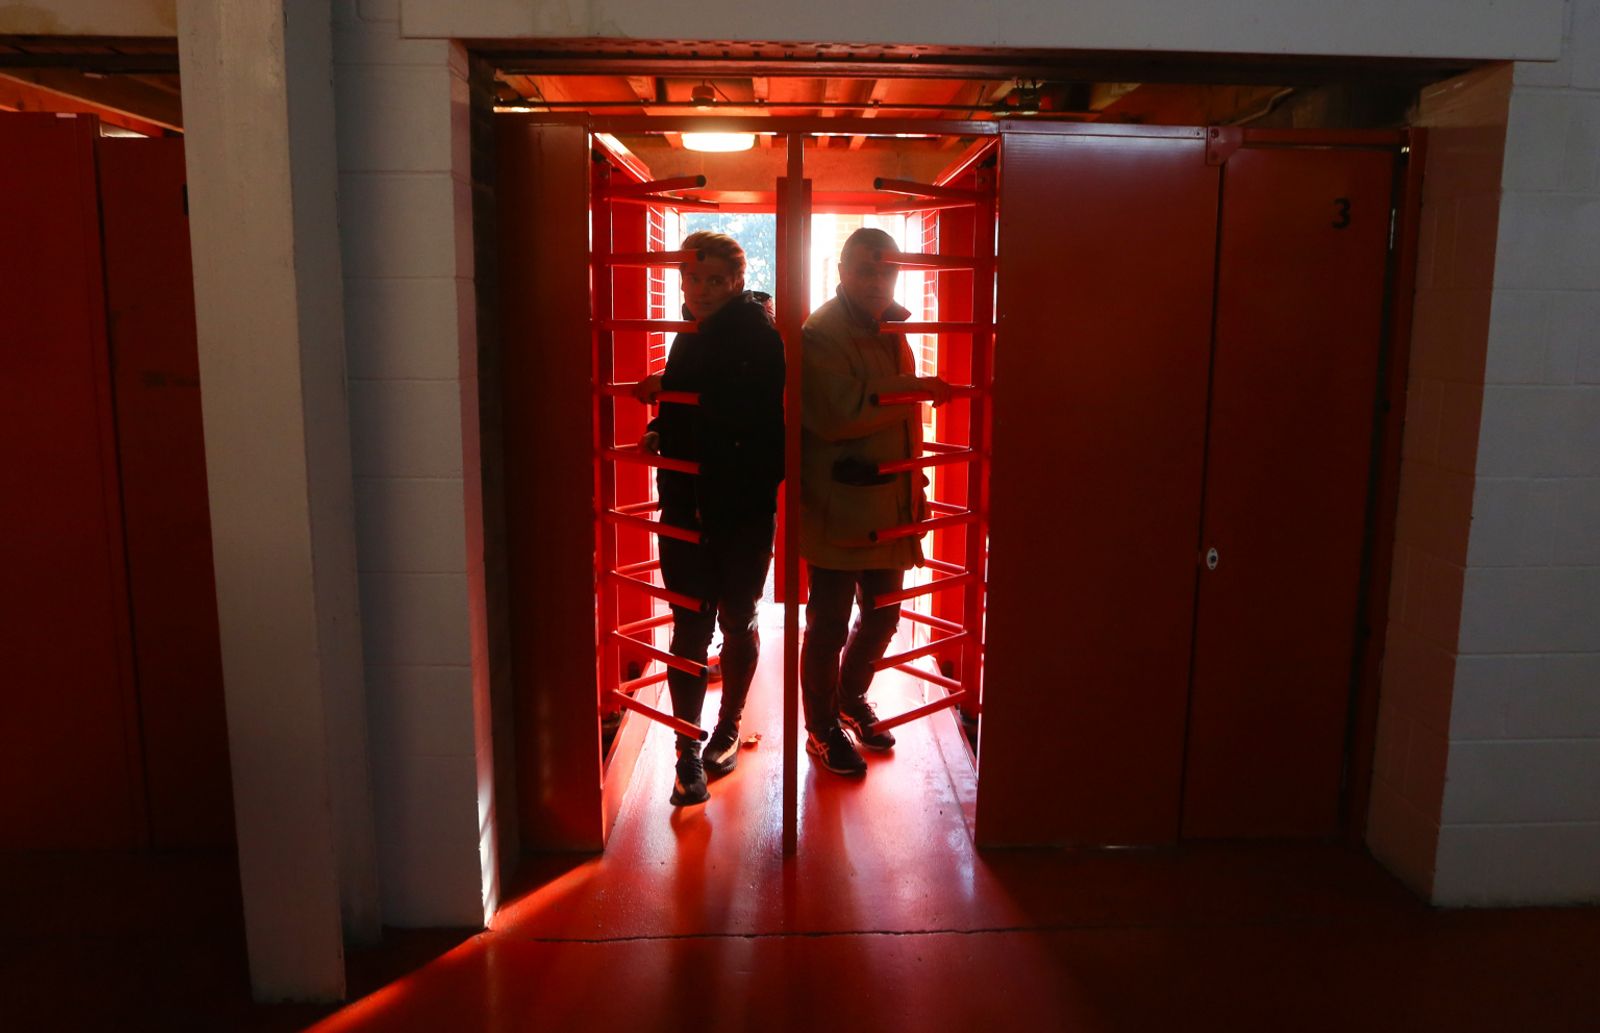
Not only did more supporters flood the turnstiles that we have seen the the second tier of the competition before.
But incredibly, eleven clubs ended the campaign averaging a four figure gate. Now that's some going!
Now, with all the top four in the attendance table taking part next season, the question is will 2018-19 see them expand even further?
We have put together our unique attendance table so you can chart exactly where your club finished in the crowd count.
What a season it was and with Sunday's Promotion Final between Harrogate and Brackley looking like a sell out it isn't over yet!
National League North Attendance Table:
1: Stockport County 3,578
2: York City 2,754
3: FC United of Manchester 2,109
4: Kidderminster Harriers 1,680
5: Salford City 1,626
6: Darlington 1,456
7: Harrogate Town 1,187
8: Chorley 1,098
9: AFC Telford United 1,074
10: Boston United 1,053
11: Southport 1,011
12: Spennymoor 825
13: Blyth Spartans 807
14: Tamworth 738
15: Leamington 661
16: Gainsborough Trinity 604
17: Nuneaton Borough 594
18: Alfreton Town 576
19: Brackley Town 533
20: Bradford PA 496
21: Curzon Ashton 421
22: North Ferriby 363










© The National League 2026